
Massachusetts permit data report
Massachusetts Building Permits, September 2026: 14,014 Filed
Published October 2, 2026. Permits filed through September 30, 2026; data pulled October 2, 2026.
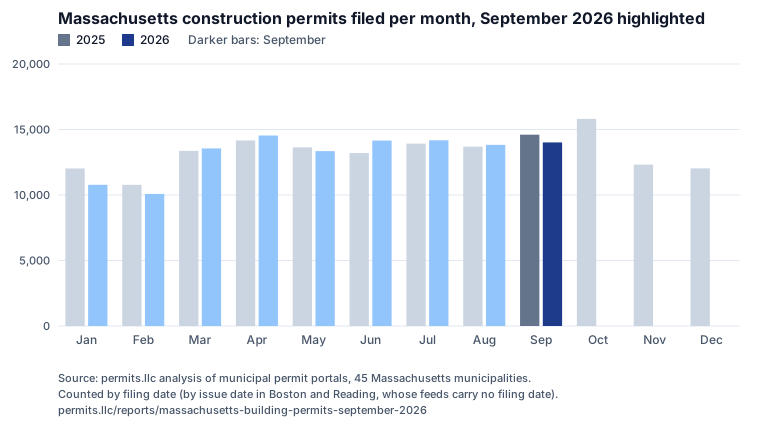
14,014 construction permits were filed in September 2026 across the 45 Massachusetts municipalities whose permit portals we track continuously, 4.0% fewer than in September 2025 (14,605).
About these figures. September 2026 figures are preliminary. Some municipal permit feeds had not finished reporting September filings when this report was built (the latest September permit we hold from Worcester is dated September 25), so the September total, its change from a year earlier and the town ranking will change once the month is complete. We will update this page with the final figures.
Compared with August 2026, filings rose 1.3%. Boston filed the most (2,711, 19.3% of the total), followed by Falmouth and Worcester. 24 of the 45 municipalities filed more permits than a year earlier and 21 filed fewer.
- Permits filed, September 2026
- 14,014
- Change vs September 2025
- −4.0%
- 14,605 a year earlier
- Change vs August 2026
- +1.3%
- 13,829 in August 2026
Massachusetts building permits by town, September 2026
The ten municipalities with the most construction permits filed, of the 45 we track continuously. The CSV has all 45.
| # | Town | Permits | Share | September 2025 | Change |
|---|---|---|---|---|---|
| 1 | Boston | 2,711 | 19.3% | 3,126 | −13.3% |
| 2 | Falmouth | 649 | 4.6% | 708 | −8.3% |
| 3 | Worcester | 608 | 4.3% | 1,208 | −49.7% |
| 4 | Billerica | 607 | 4.3% | 401 | +51.4% |
| 5 | Cambridge | 572 | 4.1% | 861 | −33.6% |
| 6 | Somerville | 505 | 3.6% | 513 | −1.6% |
| 7 | Attleboro | 439 | 3.1% | 503 | −12.7% |
| 8 | Melrose | 423 | 3.0% | 337 | +25.5% |
| 9 | Mashpee | 393 | 2.8% | 390 | +0.8% |
| 10 | Holden | 387 | 2.8% | 159 | +143.4% |
Planning a project in one of these towns? Local contractors are listed on masshomecomfort.com for Boston, Falmouth, Worcester, Billerica, Cambridge, Somerville, Attleboro, Melrose, Mashpee and Holden.
Building permits by type, September 2026
Permit types as each municipality records them. Building permits cover structural work, additions, roofing, siding, windows and similar projects; the trade permits (electrical, plumbing, gas, mechanical) are filed separately for the same jobs.
| Type | Permits | Share | September 2025 | Change |
|---|---|---|---|---|
| Building | 5,565 | 39.7% | 6,030 | −7.7% |
| Electrical | 4,094 | 29.2% | 4,248 | −3.6% |
| Plumbing | 1,974 | 14.1% | 2,037 | −3.1% |
| Gas | 1,522 | 10.9% | 1,383 | +10.1% |
| Mechanical and sheet metal | 554 | 4.0% | 467 | +18.6% |
| Trench and street opening | 104 | 0.7% | 178 | −41.6% |
| Sign | 87 | 0.6% | 101 | −13.9% |
| Fire alarm and sprinkler | 62 | 0.4% | 96 | −35.4% |
| Demolition | 52 | 0.4% | 65 | −20.0% |
Massachusetts building permits by month, 2025 vs 2026
| Month | 2025 | 2026 | Change |
|---|---|---|---|
| January | 12,022 | 10,778 | −10.3% |
| February | 10,778 | 10,080 | −6.5% |
| March | 13,370 | 13,555 | +1.4% |
| April | 14,164 | 14,541 | +2.7% |
| May | 13,639 | 13,350 | −2.1% |
| June | 13,201 | 14,156 | +7.2% |
| July | 13,924 | 14,175 | +1.8% |
| August | 13,690 | 13,829 | +1.0% |
| September | 14,605 | 14,014 | −4.0% |
| October | 15,808 | ||
| November | 12,318 | ||
| December | 12,033 |
The six months together: Massachusetts building permits, first half of 2026.
How we counted
Which municipalities. The 45 Massachusetts cities and towns whose own permit portals we have read continuously since January 2025, each with at least one construction permit in every month from January 2025 through September 2026. Every page in this series uses the same 45, so months and years compare like with like. They are not a random sample of the state: Boston alone is 19% of the total, so read the figures as these municipalities, not as a statewide count.
Which records. Construction permits only: building, electrical, plumbing, gas, mechanical and sheet metal, fire protection, trench, sign and demolition permits. Licences, food and health permits, inspections, certificates of occupancy, zoning applications and similar records that some portals publish alongside permits are excluded (27,138 such records across the whole file).
Which date. The filing (application) date, not the issue date or the date we collected the record. Permits filed late in the period can still reach the portals, so the most recent month may rise slightly when we refresh.
Duplicates. Records flagged as duplicates are excluded. A 2026 re-import of Cambridge loaded each permit twice under two number formats; the second copy (7,289 records) is removed.
Left out on purpose.Municipalities we read through a third-party records portal (Viewpoint) are not in this series. We checked that feed against Plymouth's own monthly reports and found it held a fraction of the town's permits, and a smaller fraction in 2025 than in 2026, which would show growth that did not happen. Boston and Cambridge, checked against their open-data portals for March 2025 and March 2026, matched within a few percent in both years.
Data. Town, month and permit count for all 45 municipalities: massachusetts-building-permits-september-2026.csv. No owner, applicant, contractor or address fields. Free to reuse under CC BY 4.0 with a link to this page.
Cite this data
permits.llc. "Massachusetts Building Permits, September 2026: 14,014 Filed." Published October 2, 2026. https://permits.llc/reports/massachusetts-building-permits-september-2026
Press and data questions: hello@permits.llc.